Displaying an Enlarged Portion of a Graph on Another Graph in Matplotlib
Introduction
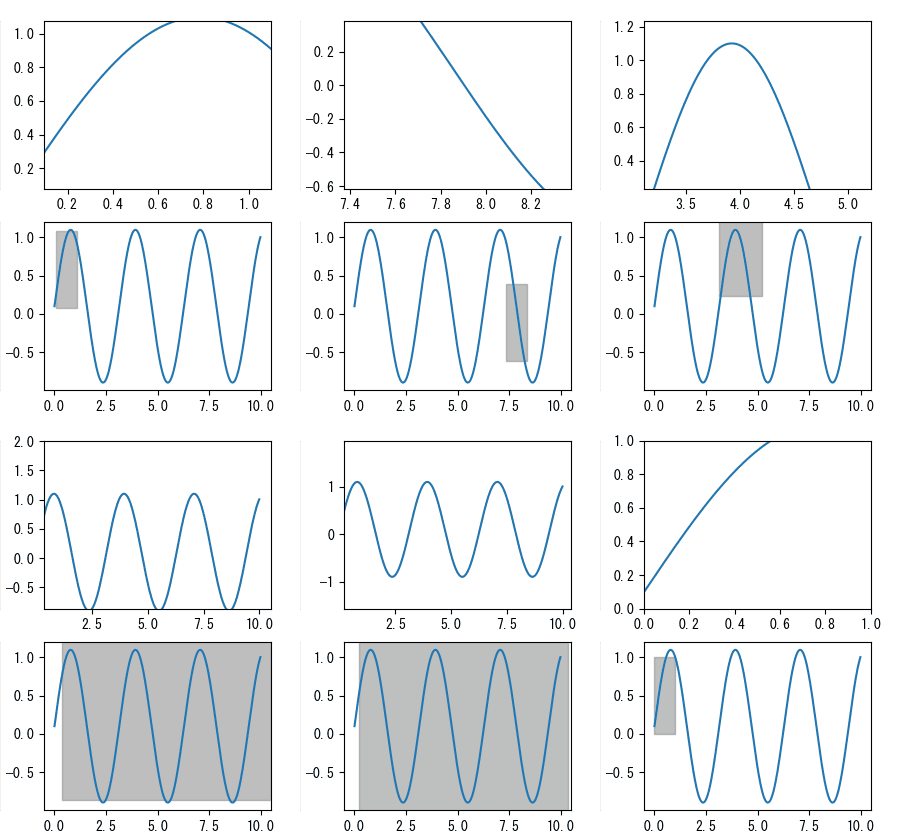
I’ve tried using two graphs in matplotlib, where one displays the entire view and the other displays an enlarged portion. Additionally, I’ve enabled the ability to freely change the zoomed-in area. Here are my notes.
What I Want to Implement
- Use two graphs, displaying the overall view on one and an enlarged portion on the other.
- Display the zoomed-in area on the overall graph.
- Enable dynamic adjustment of the zoomed-in area with the mouse.
One Graph Displays the Overall View, While the Other Displays an Enlarged Portion
This is simple. Just plot the same data on both graphs and change the display range of one.
import matplotlib.pyplot as plt
import numpy as np

fig, axes = plt.subplots(2, 1)

x = np.arange(0.0, 10.0, 0.01)
y = np.sin(2 * x) + 0.1

axes[0].plot(x, y)
axes[1].plot(x, y)

axes[1].set_xlim(0.5, 6)
axes[1].set_ylim(0, 1.25)

plt.show()
Displaying the Zoomed-in Area on the Overall Graph
You can display a rectangle corresponding to the zoomed-in area on the overview graph. To do this, create a Rectangle object and add it to the overall graph using add_patch().
import matplotlib.patches as patches

xlim = axes[1].get_xlim()
ylim = axes[1].get_ylim()

rect = patches.Rectangle([xlim[0], ylim[0]], xlim[1] - xlim[0], ylim[1] - ylim[0])
axes[0].add_patch(rect)
To Dynamically Change the Zoomed-in Area with the Mouse
To use mpl_connect() to capture mouse events, enabling the movement of the rectangle in response to dragging and simultaneously changing the display range of the zoomed-in graph.
For information on how to use mpl_connect(), please refer to the following articles.
x_on_click = 0
y_on_click = 0
box_x = 0
box_y = 0
press = False

def on_button_down(event):
    global axes, x_on_click, y_on_click, box_x, box_y, press, rect

    if event.inaxes != axes[0]:
        return

    if event.button != 1:
        return

    contains, attrd = rect.contains(event)

    if not contains:
        return

    press = True
    x_on_click = event.xdata
    y_on_click = event.ydata
    box_x = rect.get_x()
    box_y = rect.get_y()

def on_button_up(event):
    global press
    press = False

def on_mouse_move(event):
    global fig, axes, x_on_click, y_on_click, box_x, box_y, press, rect

    if not press or event.inaxes != axes[0]:
        return

    dx = event.xdata - x_on_click
    dy = event.ydata - y_on_click
    new_x = box_x + dx
    new_y = box_y + dy
    rect.set_x(new_x)
    rect.set_y(new_y)
    axes[1].set_xlim([new_x, new_x + rect.get_width()])
    axes[1].set_ylim([new_y, new_y + rect.get_height()])
    fig.canvas.draw()

fig.canvas.mpl_connect('button_press_event', on_button_down)
fig.canvas.mpl_connect('button_release_event', on_button_up)
fig.canvas.mpl_connect('motion_notify_event', on_mouse_move)
You can determine if the rectangle is clicked using Rectangle.contains(). If the rectangle is clicked, set a flag to True, and if the button is released, set the flag to False.
Implemented Code
This is a bit long, but here is the actual code. Considering ease of use, I implemented it as a class. Additionally, since the above code does not allow changing the width and height of the rectangle indicating the zoom range, I made it possible to change the width and height of the rectangle as well. For this, I used an extended version of the MplZoomHelper class created in the previous article to handle this functionality.
import matplotlib.pyplot as plt
import matplotlib.patches as patches
import numpy as np

class MplZoomHelper:
    def __init__(self, ax: plt.Axes, rect: patches.Rectangle = None):
        self.ax = ax
        self.ctrl_flag = False
        self.zoom_rate = 0.9
        self.rect = rect

        self.move_rate = 0.05
        self.x_on_click = 0
        self.y_on_click = 0
        self.xlim_on_click = ax.get_xlim()
        self.ylim_on_click = ax.get_ylim()

        self.initial_xlim = ax.get_xlim()
        self.initial_ylim = ax.get_ylim()

        ax.figure.canvas.mpl_connect('key_press_event', self.on_key_press)
        ax.figure.canvas.mpl_connect('key_release_event', self.on_key_release)
        ax.figure.canvas.mpl_connect('scroll_event', self.on_scroll)
        ax.figure.canvas.mpl_connect('button_press_event', self.on_button_press)
        ax.figure.canvas.mpl_connect('motion_notify_event', self.on_move)

    def on_key_press(self, event):
        if event.inaxes is not self.ax:
            return

        if event.key == 'control':
            self.ctrl_flag = True
        elif event.key == 'h':
            self.on_home(event)
        elif event.key == 'right':
            self.on_move_x(event, 1)
        elif event.key == 'left':
            self.on_move_x(event, -1)
        elif event.key == 'up':
            self.on_move_y(event, 1)
        elif event.key == 'down':
            self.on_move_y(event, -1)

    def on_key_release(self, event):
        if event.inaxes is not self.ax:
            return

        if event.key == 'control':
            self.ctrl_flag = False

    def on_home(self, event):
        self.ax.set_xlim(self.initial_xlim)
        self.ax.set_ylim(self.initial_ylim)

        if self.rect is not None:
            self.rect.set_xy([self.initial_xlim[0], self.initial_ylim[0]])
            self.rect.set_width(self.initial_xlim[1] - self.initial_xlim[0])
            self.rect.set_height(self.initial_ylim[1] - self.initial_ylim[0])

        self.ax.figure.canvas.draw()

    def on_scroll(self, event):
        if event.inaxes is not self.ax:
            return

        if self.ctrl_flag:
            self.on_scroll_y(event)
        else:
            self.on_scroll_x(event)

        self.ax.figure.canvas.draw()

    def on_scroll_x(self, event):
        x_pos = event.xdata
        min_value, max_value = self.ax.get_xlim()

        if event.button == 'up':
            new_min_value = x_pos - (x_pos - min_value) * self.zoom_rate
            new_max_value = (max_value - x_pos) * self.zoom_rate + x_pos
        elif event.button == 'down':
            new_min_value = x_pos - (x_pos - min_value) / self.zoom_rate
            new_max_value = (max_value - x_pos) / self.zoom_rate + x_pos

        self.ax.set_xlim(new_min_value, new_max_value)

        if self.rect is not None:
            self.rect.set_x(new_min_value)
            self.rect.set_width(new_max_value - new_min_value)

    def on_scroll_y(self, event):
        y_pos = event.ydata
        min_value, max_value = self.ax.get_ylim()

        if event.button == 'up':
            new_min_value = y_pos - (y_pos - min_value) * self.zoom_rate
            new_max_value = (max_value - y_pos) * self.zoom_rate + y_pos
        elif event.button == 'down':
            new_min_value = y_pos - (y_pos - min_value) / self.zoom_rate
            new_max_value = (max_value - y_pos) / self.zoom_rate + y_pos

        self.ax.set_ylim(new_min_value, new_max_value)

        if self.rect is not None:
            self.rect.set_y(new_min_value)
            self.rect.set_height(new_max_value - new_min_value)

    def on_button_press(self, event):
        if event.inaxes is not self.ax:
            return

        if event.button != 1:
            return

        self.x_on_click = event.xdata
        self.y_on_click = event.ydata
        self.xlim_on_click = self.ax.get_xlim()
        self.ylim_on_click = self.ax.get_ylim()

    def on_move(self, event):
        if event.inaxes is not self.ax:
            return

        if event.button != 1:
            return

        dx = event.xdata - self.x_on_click
        dy = event.ydata - self.y_on_click
        self.xlim_on_click -= dx
        self.ylim_on_click -= dy
        self.ax.set_xlim(self.xlim_on_click)
        self.ax.set_ylim(self.ylim_on_click)

        if self.rect is not None:
            self.rect.set_x(self.xlim_on_click[0])
            self.rect.set_y(self.ylim_on_click[0])

        self.ax.figure.canvas.draw()

    def on_move_x(self, event, dir):
        min_value, max_value = self.ax.get_xlim()
        width = max_value - min_value
        dx = width * self.move_rate * dir
        self.ax.set_xlim(min_value + dx, max_value + dx)

        if self.rect is not None:
            self.rect.set_x(min_value + dx)

        self.ax.figure.canvas.draw()

    def on_move_y(self, event, dir):
        min_value, max_value = self.ax.get_ylim()
        width = max_value - min_value
        dy = width * self.move_rate * dir
        self.ax.set_ylim(min_value + dy, max_value + dy)

        if self.rect is not None:
            self.rect.set_y(min_value + dy)

        self.ax.figure.canvas.draw()

class MplZoomPlot:
    def __init__(self, ax: plt.Axes, sub_ax: plt.Axes):
        self.ax = ax
        self.sub_ax = sub_ax

        xlim = ax.get_xlim()
        ylim = ax.get_ylim()
        self.sub_ax.set_xlim(xlim)
        self.sub_ax.set_ylim(ylim)
        self.x_on_click = 0
        self.y_on_click = 0
        self.box_x = 0
        self.box_y = 0
        self.press = False

        self.rect = patches.Rectangle([xlim[0], ylim[0]], xlim[1] - xlim[0], ylim[1] - ylim[0])
        self.rect.set_facecolor('grey')
        self.rect.set_edgecolor('grey')
        self.rect.set_alpha(0.5)
        self.ax.add_patch(self.rect)

        self.rect.axes.figure.canvas.mpl_connect('button_press_event', self.on_button_down)
        self.rect.axes.figure.canvas.mpl_connect('button_release_event', self.on_button_up)
        self.rect.axes.figure.canvas.mpl_connect('motion_notify_event', self.on_mouse_move)

        self.zoom = MplZoomHelper(self.sub_ax, self.rect)

    def plot(self, x, y, *args, **kwargs):
        self.ax.plot(x, y, *args, **kwargs)
        self.sub_ax.plot(x, y, *args, **kwargs)

    def set_sub_ax_xlim(self, xmin, xmax):
        self.rect.set_x(xmin)
        self.rect.set_width(xmax - xmin)
        self.sub_ax.set_xlim(xmin, xmax)

    def set_sub_ax_ylim(self, ymin, ymax):
        self.rect.set_y(ymin)
        self.rect.set_height(ymax - ymin)
        self.sub_ax.set_ylim(ymin, ymax)

    def on_button_down(self, event):
        if event.inaxes != self.ax:
            return

        if event.button != 1:
            return

        contains, attrd = self.rect.contains(event)

        if not contains:
            return

        self.press = True
        self.x_on_click = event.xdata
        self.y_on_click = event.ydata
        self.box_x = self.rect.get_x()
        self.box_y = self.rect.get_y()

    def on_button_up(self, event):
        self.press = False
        self.ax.figure.canvas.draw()

    def on_mouse_move(self, event):
        if not self.press or event.inaxes != self.ax:
            return

        dx = event.xdata - self.x_on_click
        dy = event.ydata - self.y_on_click
        new_x = self.box_x + dx
        new_y = self.box_y + dy
        self.rect.set_x(new_x)
        self.rect.set_y(new_y)
        self.sub_ax.set_xlim([new_x, new_x + self.rect.get_width()])
        self.sub_ax.set_ylim([new_y, new_y + self.rect.get_height()])
        self.ax.figure.canvas.draw()

if __name__ == "__main__":
    fig, axes = plt.subplots(2, 1)

    x = np.arange(0.0, 10.0, 0.01)
    y = np.sin(2 * x) + 0.1

    zp = MplZoomPlot(axes[1], axes[0])
    zp.plot(x, y)
    zp.set_sub_ax_xlim(0, 1)
    zp.set_sub_ax_ylim(0, 1.25)

    plt.show()
Here is a GIF animation showing the actual graph displayed using the above code.

The range displayed in the gray rectangle within the lower graph is shown in the upper graph. When you drag this gray rectangle with the mouse, the display range of the upper graph changes correspondingly. Additionally, moving the mouse wheel within the upper graph changes the size of the gray rectangle in the X direction. Moving the mouse wheel while holding down the Ctrl key changes the size of the gray rectangle in the Y direction. Furthermore, pressing the 'h' key returns the graph to its initial position.
Conclusion
I presented code that uses two graphs: one displaying the overall view and the other displaying an enlarged portion, with the ability to freely change the enlarged display range using the mouse. Although the code is somewhat complex, it has been implemented as a class for general use, making it easier to use.
This code should be effectively useful in cases where you need to enlarge and observe specific portions, such as spectra.


Discussion
New Comments
No comments yet. Be the first one!