【Python】【matplotlib】グラフの一部を拡大し別のグラフに表示する
はじめに
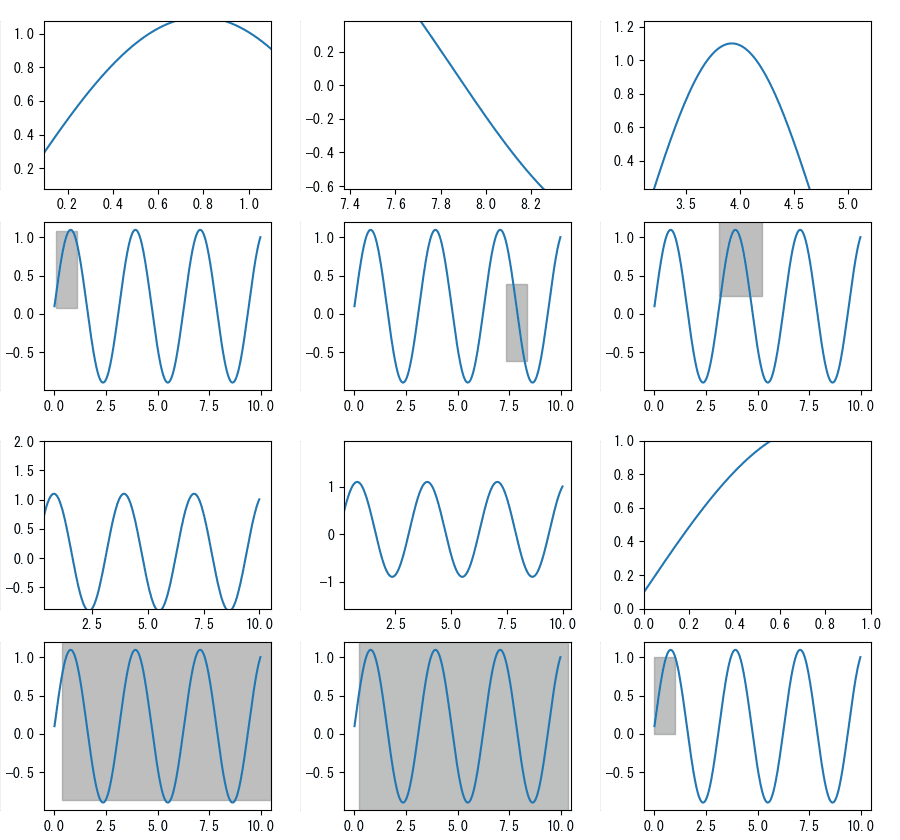
matplotlibで2つのグラフを使い、片方には全体を、もう片方には一部を拡大したものを表示できるようにしてみました。また、拡大表示する範囲を自由に変更できるようにもしました。そのメモです。
やりたいこと
- 2つのグラフを使い、片方に全体図を、もう片方に一部を拡大した図を表示する
- 全体図に拡大部分を図示する
- 拡大部分をマウスで動的に変更できるようにする
片方に全体図を、もう片方に一部を拡大した図を表示する
これは簡単です。両方のグラフに同じデータをプロットし、片方の表示範囲を変えるだけです。
import matplotlib.pyplot as plt
import numpy as np

fig, axes = plt.subplots(2, 1)

x = np.arange(0.0, 10.0, 0.01)
y = np.sin(2 * x) + 0.1

axes[0].plot(x, y)
axes[1].plot(x, y)

axes[1].set_xlim(0.5, 6)
axes[1].set_ylim(0, 1.25)

plt.show()
全体図に拡大部分を図示する
拡大図の表示範囲に該当する部分に四角を表示します。これには、Rectangleオブジェクトを生成し、全体図に対してadd_patch()します。
import matplotlib.patches as patches

xlim = axes[1].get_xlim()
ylim = axes[1].get_ylim()

rect = patches.Rectangle([xlim[0], ylim[0]], xlim[1] - xlim[0], ylim[1] - ylim[0])
axes[0].add_patch(rect)
拡大部分をマウスで動的に変更する
mpl_connect()を使って、マウス操作に関するイベントを取得できるようにします。ドラッグ操作に対応して四角を動かし、連動して拡大図の表示範囲を変更します。
mpl_connect()の使い方については、以下のエントリを参照してください。
x_on_click = 0
y_on_click = 0
box_x = 0
box_y = 0
press = False

def on_button_down(event):
    global axes, x_on_click, y_on_click, box_x, box_y, press, rect

    if event.inaxes != axes[0]:
        return

    if event.button != 1:
        return

    contains, attrd = rect.contains(event)

    if not contains:
        return

    press = True
    x_on_click = event.xdata
    y_on_click = event.ydata
    box_x = rect.get_x()
    box_y = rect.get_y()

def on_button_up(event):
    global press
    press = False

def on_mouse_move(event):
    global fig, axes, x_on_click, y_on_click, box_x, box_y, press, rect

    if not press or event.inaxes != axes[0]:
        return

    dx = event.xdata - x_on_click
    dy = event.ydata - y_on_click
    new_x = box_x + dx
    new_y = box_y + dy
    rect.set_x(new_x)
    rect.set_y(new_y)
    axes[1].set_xlim([new_x, new_x + rect.get_width()])
    axes[1].set_ylim([new_y, new_y + rect.get_height()])
    fig.canvas.draw()

fig.canvas.mpl_connect('button_press_event', on_button_down)
fig.canvas.mpl_connect('button_release_event', on_button_up)
fig.canvas.mpl_connect('motion_notify_event', on_mouse_move)四角をクリックしたかどうかは、Rectangle.contains()を使って判定できます。四角をクリックした場合はフラグをTrueにし、ボタンが離された場合はフラグをFalseにします。
実際のコード
ちょっと長いですが、以下に実際のコードを示します。使い勝手を考え、クラスで実装しました。また、上記のみでは拡大する範囲を示す四角の幅や高さを変えることができないため、四角の幅と高さも変えられるようにしました。これには、以前のエントリで作成したMplZoomHelperクラスを拡張したものを使用し、対応しました。
import matplotlib.pyplot as plt
import matplotlib.patches as patches
import numpy as np

class MplZoomHelper:
    def __init__(self, ax: plt.Axes, rect: patches.Rectangle = None):
        self.ax = ax
        self.ctrl_flag = False
        self.zoom_rate = 0.9
        self.rect = rect

        self.move_rate = 0.05
        self.x_on_click = 0
        self.y_on_click = 0
        self.xlim_on_click = ax.get_xlim()
        self.ylim_on_click = ax.get_ylim()

        self.initial_xlim = ax.get_xlim()
        self.initial_ylim = ax.get_ylim()

        ax.figure.canvas.mpl_connect('key_press_event', self.on_key_press)
        ax.figure.canvas.mpl_connect('key_release_event', self.on_key_release)
        ax.figure.canvas.mpl_connect('scroll_event', self.on_scroll)
        ax.figure.canvas.mpl_connect('button_press_event', self.on_button_press)
        ax.figure.canvas.mpl_connect('motion_notify_event', self.on_move)

    def on_key_press(self, event):
        if event.inaxes is not self.ax:
            return

        if event.key == 'control':
            self.ctrl_flag = True
        elif event.key == 'h':
            self.on_home(event)
        elif event.key == 'right':
            self.on_move_x(event, 1)
        elif event.key == 'left':
            self.on_move_x(event, -1)
        elif event.key == 'up':
            self.on_move_y(event, 1)
        elif event.key == 'down':
            self.on_move_y(event, -1)

    def on_key_release(self, event):
        if event.inaxes is not self.ax:
            return

        if event.key == 'control':
            self.ctrl_flag = False

    def on_home(self, event):
        self.ax.set_xlim(self.initial_xlim)
        self.ax.set_ylim(self.initial_ylim)

        if self.rect is not None:
            self.rect.set_xy([self.initial_xlim[0], self.initial_ylim[0]])
            self.rect.set_width(self.initial_xlim[1] - self.initial_xlim[0])
            self.rect.set_height(self.initial_ylim[1] - self.initial_ylim[0])

        self.ax.figure.canvas.draw()

    def on_scroll(self, event):
        if event.inaxes is not self.ax:
            return

        if self.ctrl_flag:
            self.on_scroll_y(event)
        else:
            self.on_scroll_x(event)

        self.ax.figure.canvas.draw()

    def on_scroll_x(self, event):
        x_pos = event.xdata
        min_value, max_value = self.ax.get_xlim()

        if event.button == 'up':
            new_min_value = x_pos - (x_pos - min_value) * self.zoom_rate
            new_max_value = (max_value - x_pos) * self.zoom_rate + x_pos
        elif event.button == 'down':
            new_min_value = x_pos - (x_pos - min_value) / self.zoom_rate
            new_max_value = (max_value - x_pos) / self.zoom_rate + x_pos

        self.ax.set_xlim(new_min_value, new_max_value)

        if self.rect is not None:
            self.rect.set_x(new_min_value)
            self.rect.set_width(new_max_value - new_min_value)

    def on_scroll_y(self, event):
        y_pos = event.ydata
        min_value, max_value = self.ax.get_ylim()

        if event.button == 'up':
            new_min_value = y_pos - (y_pos - min_value) * self.zoom_rate
            new_max_value = (max_value - y_pos) * self.zoom_rate + y_pos
        elif event.button == 'down':
            new_min_value = y_pos - (y_pos - min_value) / self.zoom_rate
            new_max_value = (max_value - y_pos) / self.zoom_rate + y_pos

        self.ax.set_ylim(new_min_value, new_max_value)

        if self.rect is not None:
            self.rect.set_y(new_min_value)
            self.rect.set_height(new_max_value - new_min_value)

    def on_button_press(self, event):
        if event.inaxes is not self.ax:
            return

        if event.button != 1:
            return

        self.x_on_click = event.xdata
        self.y_on_click = event.ydata
        self.xlim_on_click = self.ax.get_xlim()
        self.ylim_on_click = self.ax.get_ylim()

    def on_move(self, event):
        if event.inaxes is not self.ax:
            return

        if event.button != 1:
            return

        dx = event.xdata - self.x_on_click
        dy = event.ydata - self.y_on_click
        self.xlim_on_click -= dx
        self.ylim_on_click -= dy
        self.ax.set_xlim(self.xlim_on_click)
        self.ax.set_ylim(self.ylim_on_click)

        if self.rect is not None:
            self.rect.set_x(self.xlim_on_click[0])
            self.rect.set_y(self.ylim_on_click[0])

        self.ax.figure.canvas.draw()

    def on_move_x(self, event, dir):
        min_value, max_value = self.ax.get_xlim()
        width = max_value - min_value
        dx = width * self.move_rate * dir
        self.ax.set_xlim(min_value + dx, max_value + dx)

        if self.rect is not None:
            self.rect.set_x(min_value + dx)

        self.ax.figure.canvas.draw()

    def on_move_y(self, event, dir):
        min_value, max_value = self.ax.get_ylim()
        width = max_value - min_value
        dy = width * self.move_rate * dir
        self.ax.set_ylim(min_value + dy, max_value + dy)

        if self.rect is not None:
            self.rect.set_y(min_value + dy)

        self.ax.figure.canvas.draw()

class MplZoomPlot:
    def __init__(self, ax: plt.Axes, sub_ax: plt.Axes):
        self.ax = ax
        self.sub_ax = sub_ax

        xlim = ax.get_xlim()
        ylim = ax.get_ylim()
        self.sub_ax.set_xlim(xlim)
        self.sub_ax.set_ylim(ylim)
        self.x_on_click = 0
        self.y_on_click = 0
        self.box_x = 0
        self.box_y = 0
        self.press = False

        self.rect = patches.Rectangle([xlim[0], ylim[0]], xlim[1] - xlim[0], ylim[1] - ylim[0])
        self.rect.set_facecolor('grey')
        self.rect.set_edgecolor('grey')
        self.rect.set_alpha(0.5)
        self.ax.add_patch(self.rect)

        self.rect.axes.figure.canvas.mpl_connect('button_press_event', self.on_button_down)
        self.rect.axes.figure.canvas.mpl_connect('button_release_event', self.on_button_up)
        self.rect.axes.figure.canvas.mpl_connect('motion_notify_event', self.on_mouse_move)

        self.zoom = MplZoomHelper(self.sub_ax, self.rect)

    def plot(self, x, y, *args, **kwargs):
        self.ax.plot(x, y, *args, **kwargs)
        self.sub_ax.plot(x, y, *args, **kwargs)

    def set_sub_ax_xlim(self, xmin, xmax):
        self.rect.set_x(xmin)
        self.rect.set_width(xmax - xmin)
        self.sub_ax.set_xlim(xmin, xmax)

    def set_sub_ax_ylim(self, ymin, ymax):
        self.rect.set_y(ymin)
        self.rect.set_height(ymax - ymin)
        self.sub_ax.set_ylim(ymin, ymax)

    def on_button_down(self, event):
        if event.inaxes != self.ax:
            return

        if event.button != 1:
            return

        contains, attrd = self.rect.contains(event)

        if not contains:
            return

        self.press = True
        self.x_on_click = event.xdata
        self.y_on_click = event.ydata
        self.box_x = self.rect.get_x()
        self.box_y = self.rect.get_y()

    def on_button_up(self, event):
        self.press = False
        self.ax.figure.canvas.draw()

    def on_mouse_move(self, event):
        if not self.press or event.inaxes != self.ax:
            return

        dx = event.xdata - self.x_on_click
        dy = event.ydata - self.y_on_click
        new_x = self.box_x + dx
        new_y = self.box_y + dy
        self.rect.set_x(new_x)
        self.rect.set_y(new_y)
        self.sub_ax.set_xlim([new_x, new_x + self.rect.get_width()])
        self.sub_ax.set_ylim([new_y, new_y + self.rect.get_height()])
        self.ax.figure.canvas.draw()

if __name__ == "__main__":
    fig, axes = plt.subplots(2, 1)

    x = np.arange(0.0, 10.0, 0.01)
    y = np.sin(2 * x) + 0.1

    zp = MplZoomPlot(axes[1], axes[0])
    zp.plot(x, y)
    zp.set_sub_ax_xlim(0, 1)
    zp.set_sub_ax_ylim(0, 1.25)

    plt.show()
上記コードを使って、実際にグラフを表示させたものが以下のGIFアニメーションです。

下のグラフ内にある灰色の四角で表示された範囲が上のグラフに表示されます。この灰色の四角をマウスでドラッグすると、連動して上のグラフの表示範囲が変わります。また、上のグラフ内でマウスのホイールを動かすと、灰色の四角の大きさ(X方向)が変わります。Ctrlキーを押しながらマウスのホイールを動かすと、灰色の四角のY方向の大きさが変わります。さらに、hキーを押すと最初の位置に戻ります。
おわりに
2つのグラフを使って、片方に全体図、もう片方に一部を拡大したグラフを表示し、さらに拡大表示する範囲をマウスで自由に変更できるコードを示しました。やや複雑なコードではありますが、汎用的に使えるようにクラスとして実装したので、使いやすくなっていると思います。
スペクトルなど、一部を拡大して観察するような場合に、本コードが有効に使えると思います。


ディスカッション
コメント一覧
まだ、コメントがありません